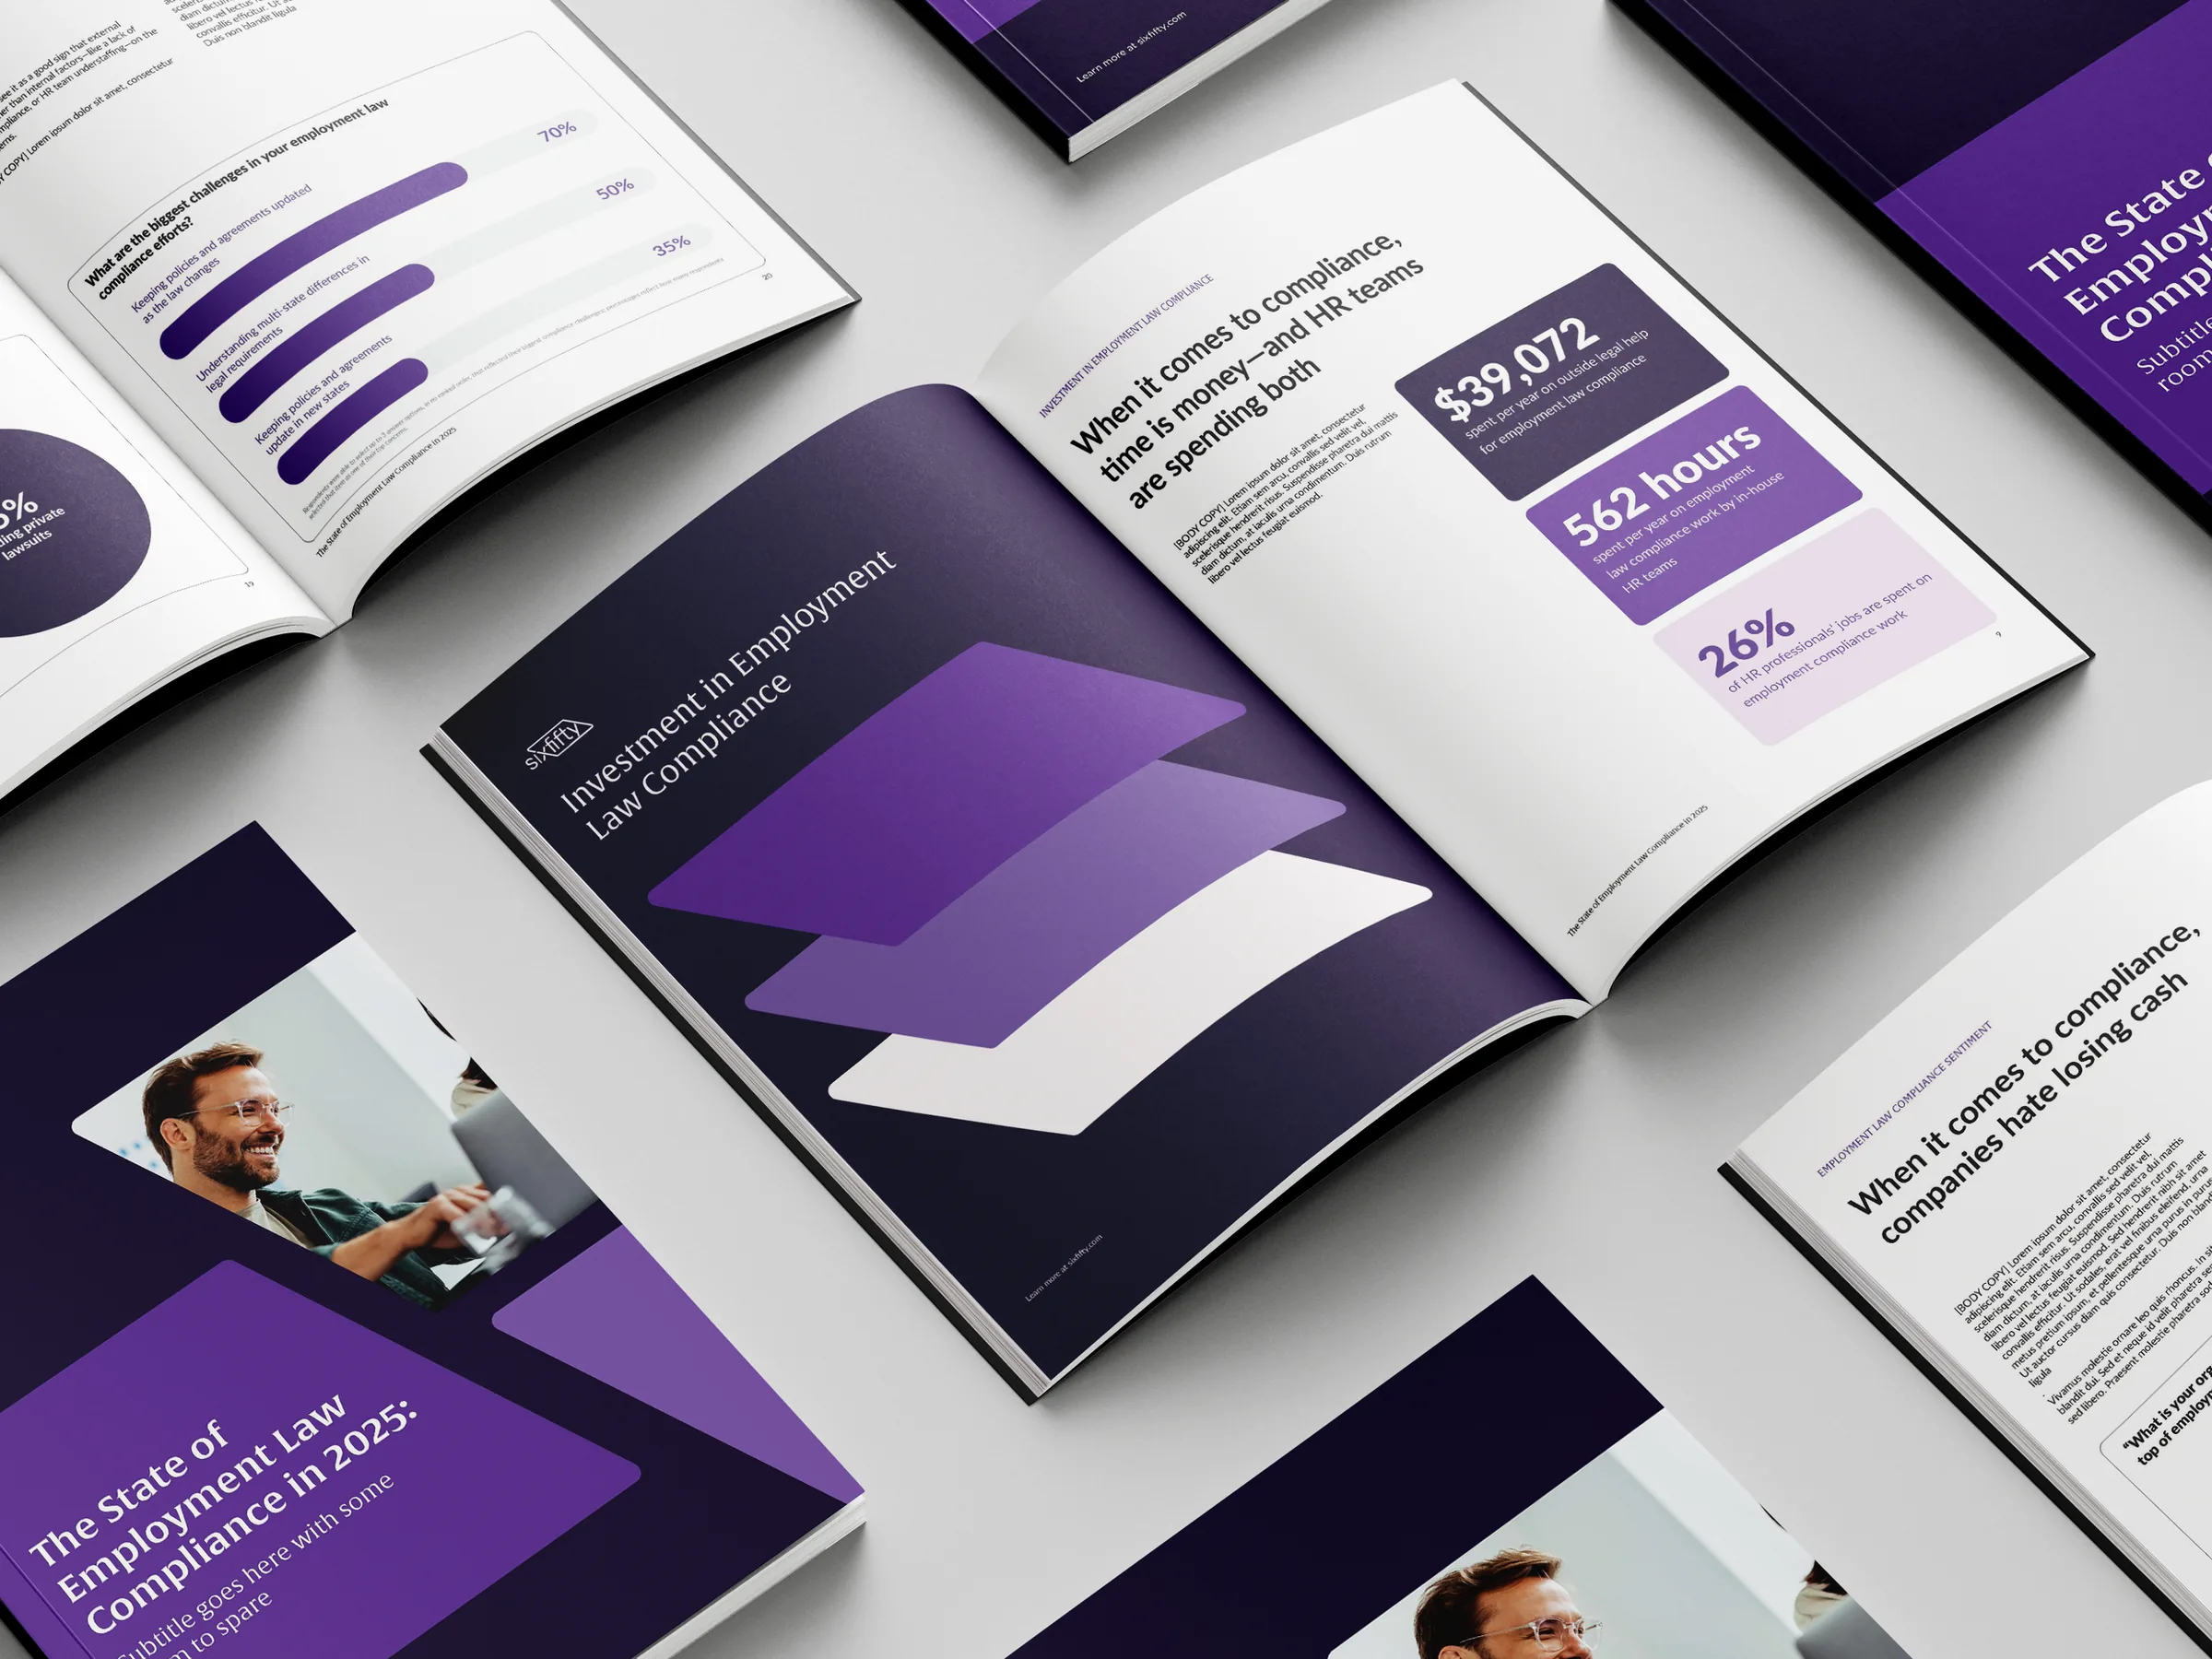
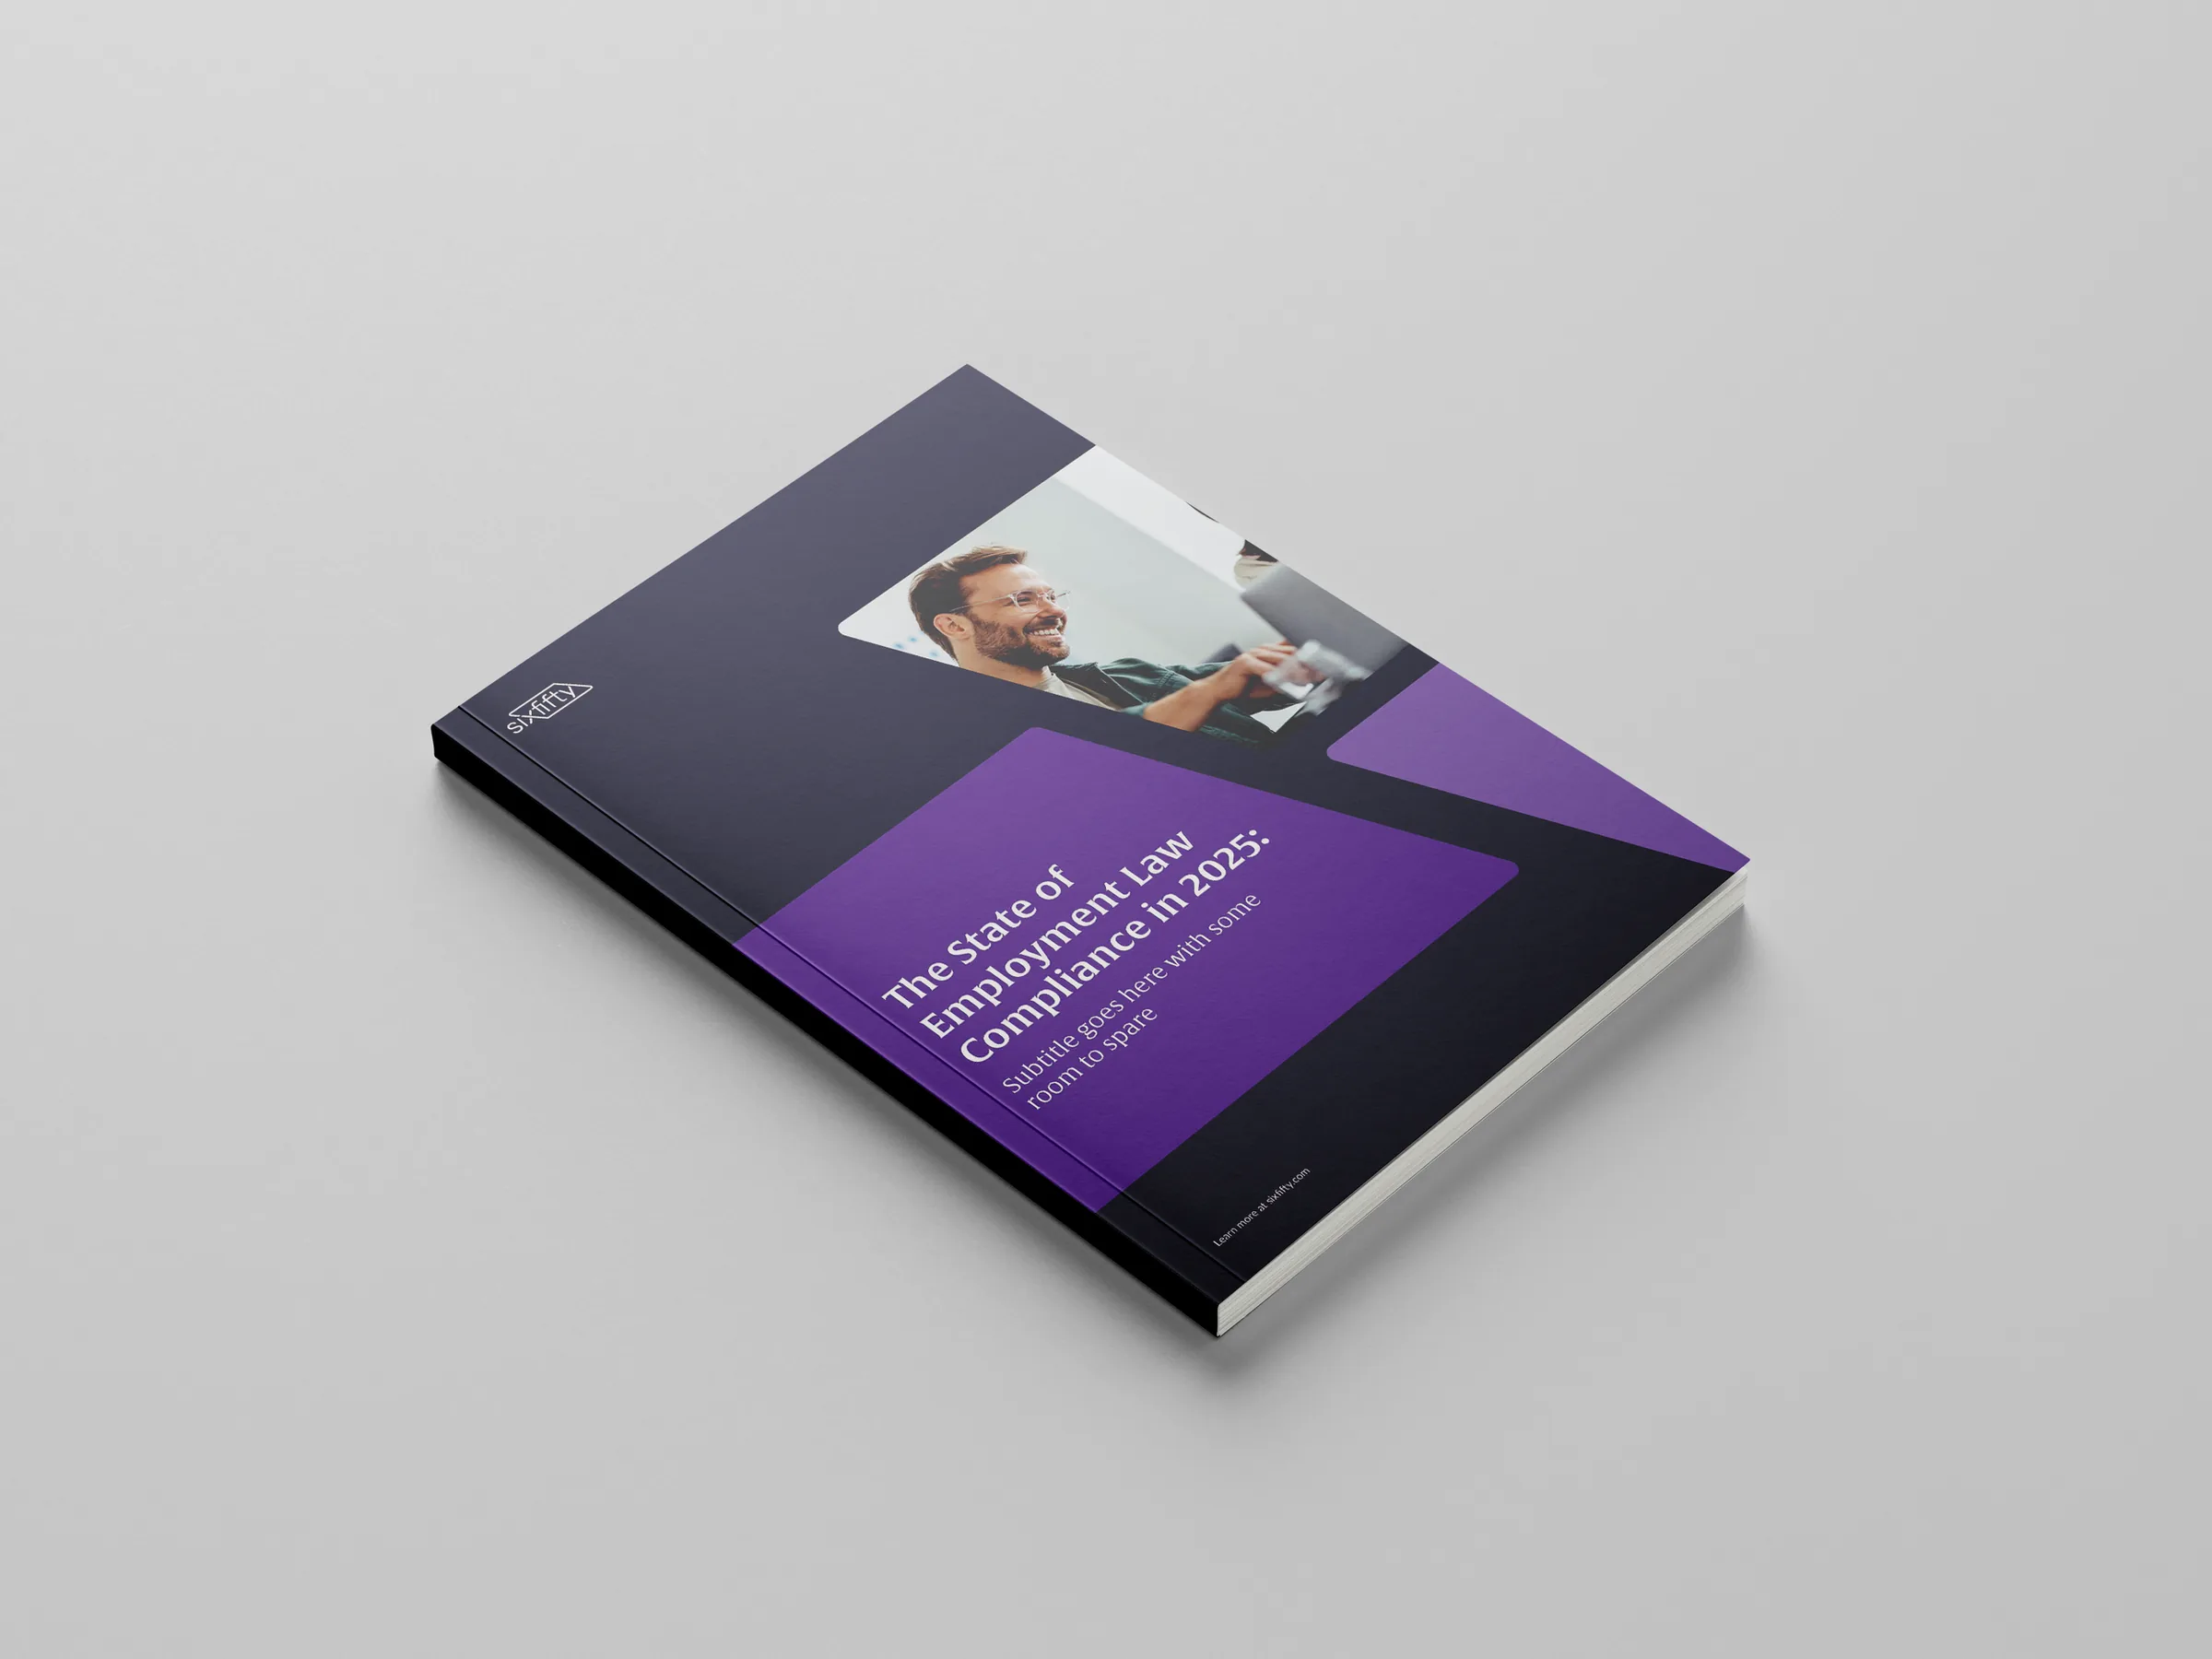
State of Compliance report
A gated editorial report that turns third-party research into thought leadership and qualified leads for SixFifty.
- Ryker designed a gated State of Compliance report for SixFifty as a freelance graphic designer.
- The goal: position SixFifty as a thought leader in legal compliance and generate qualified leads.
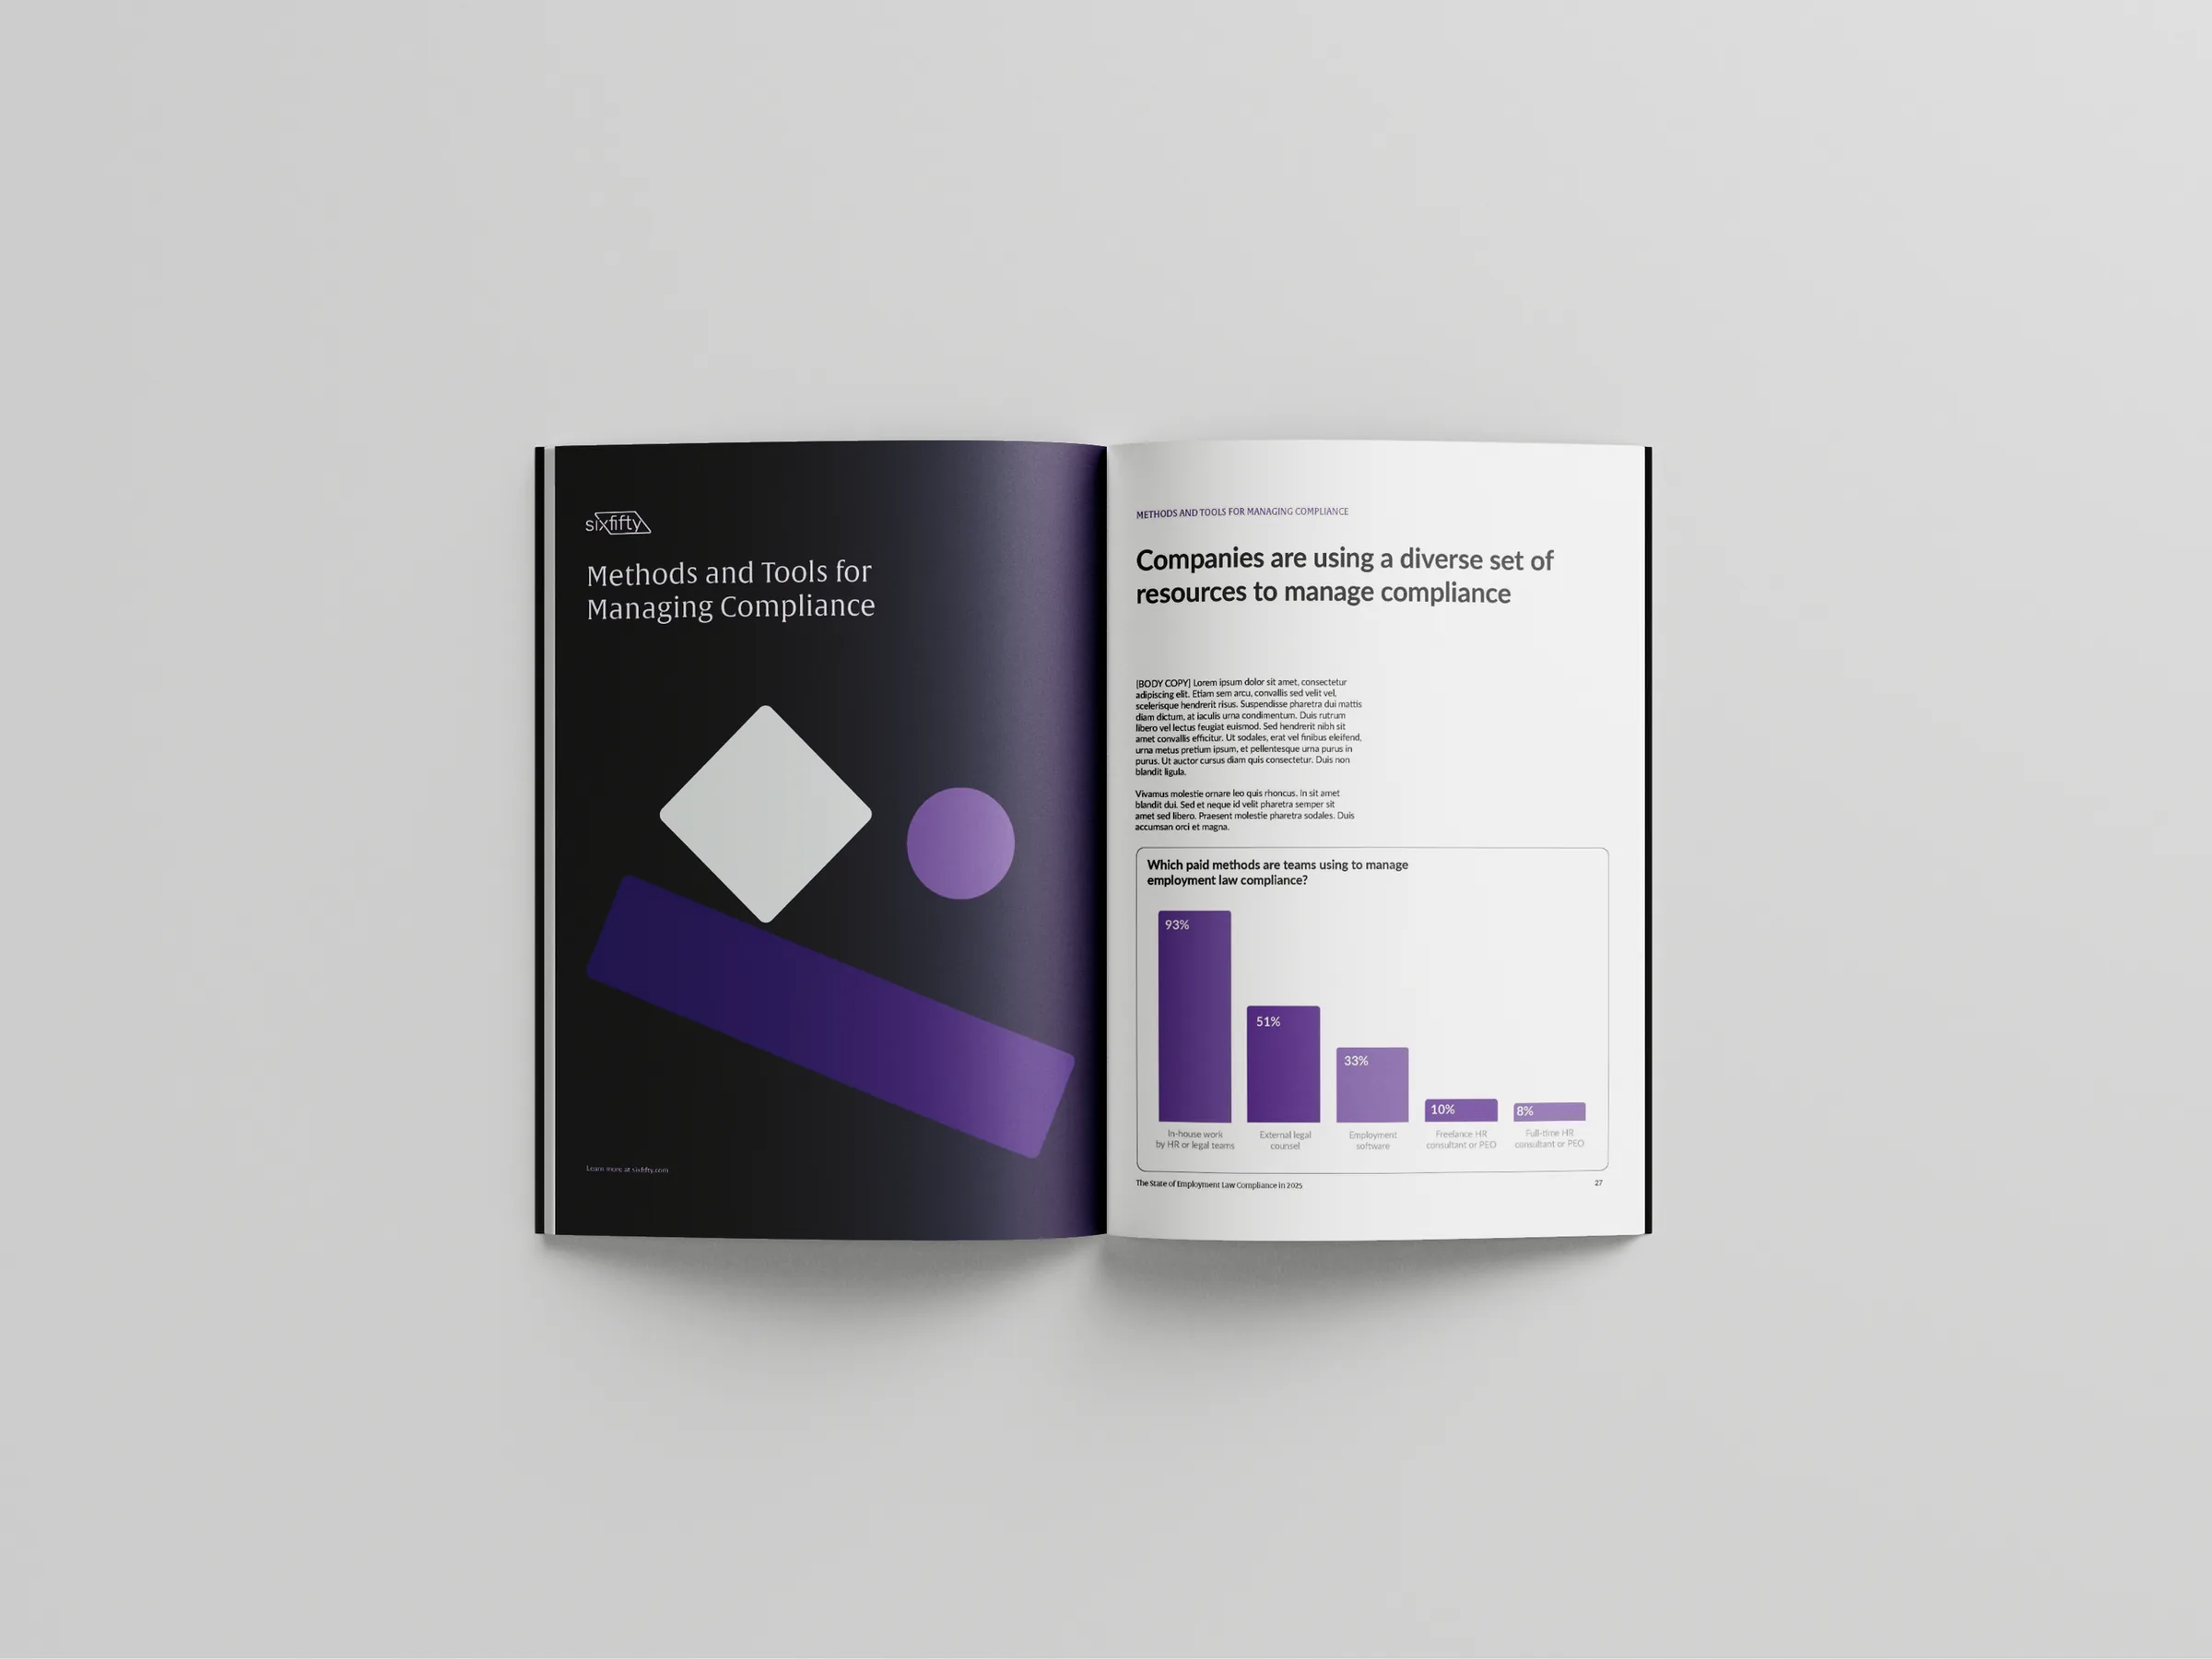
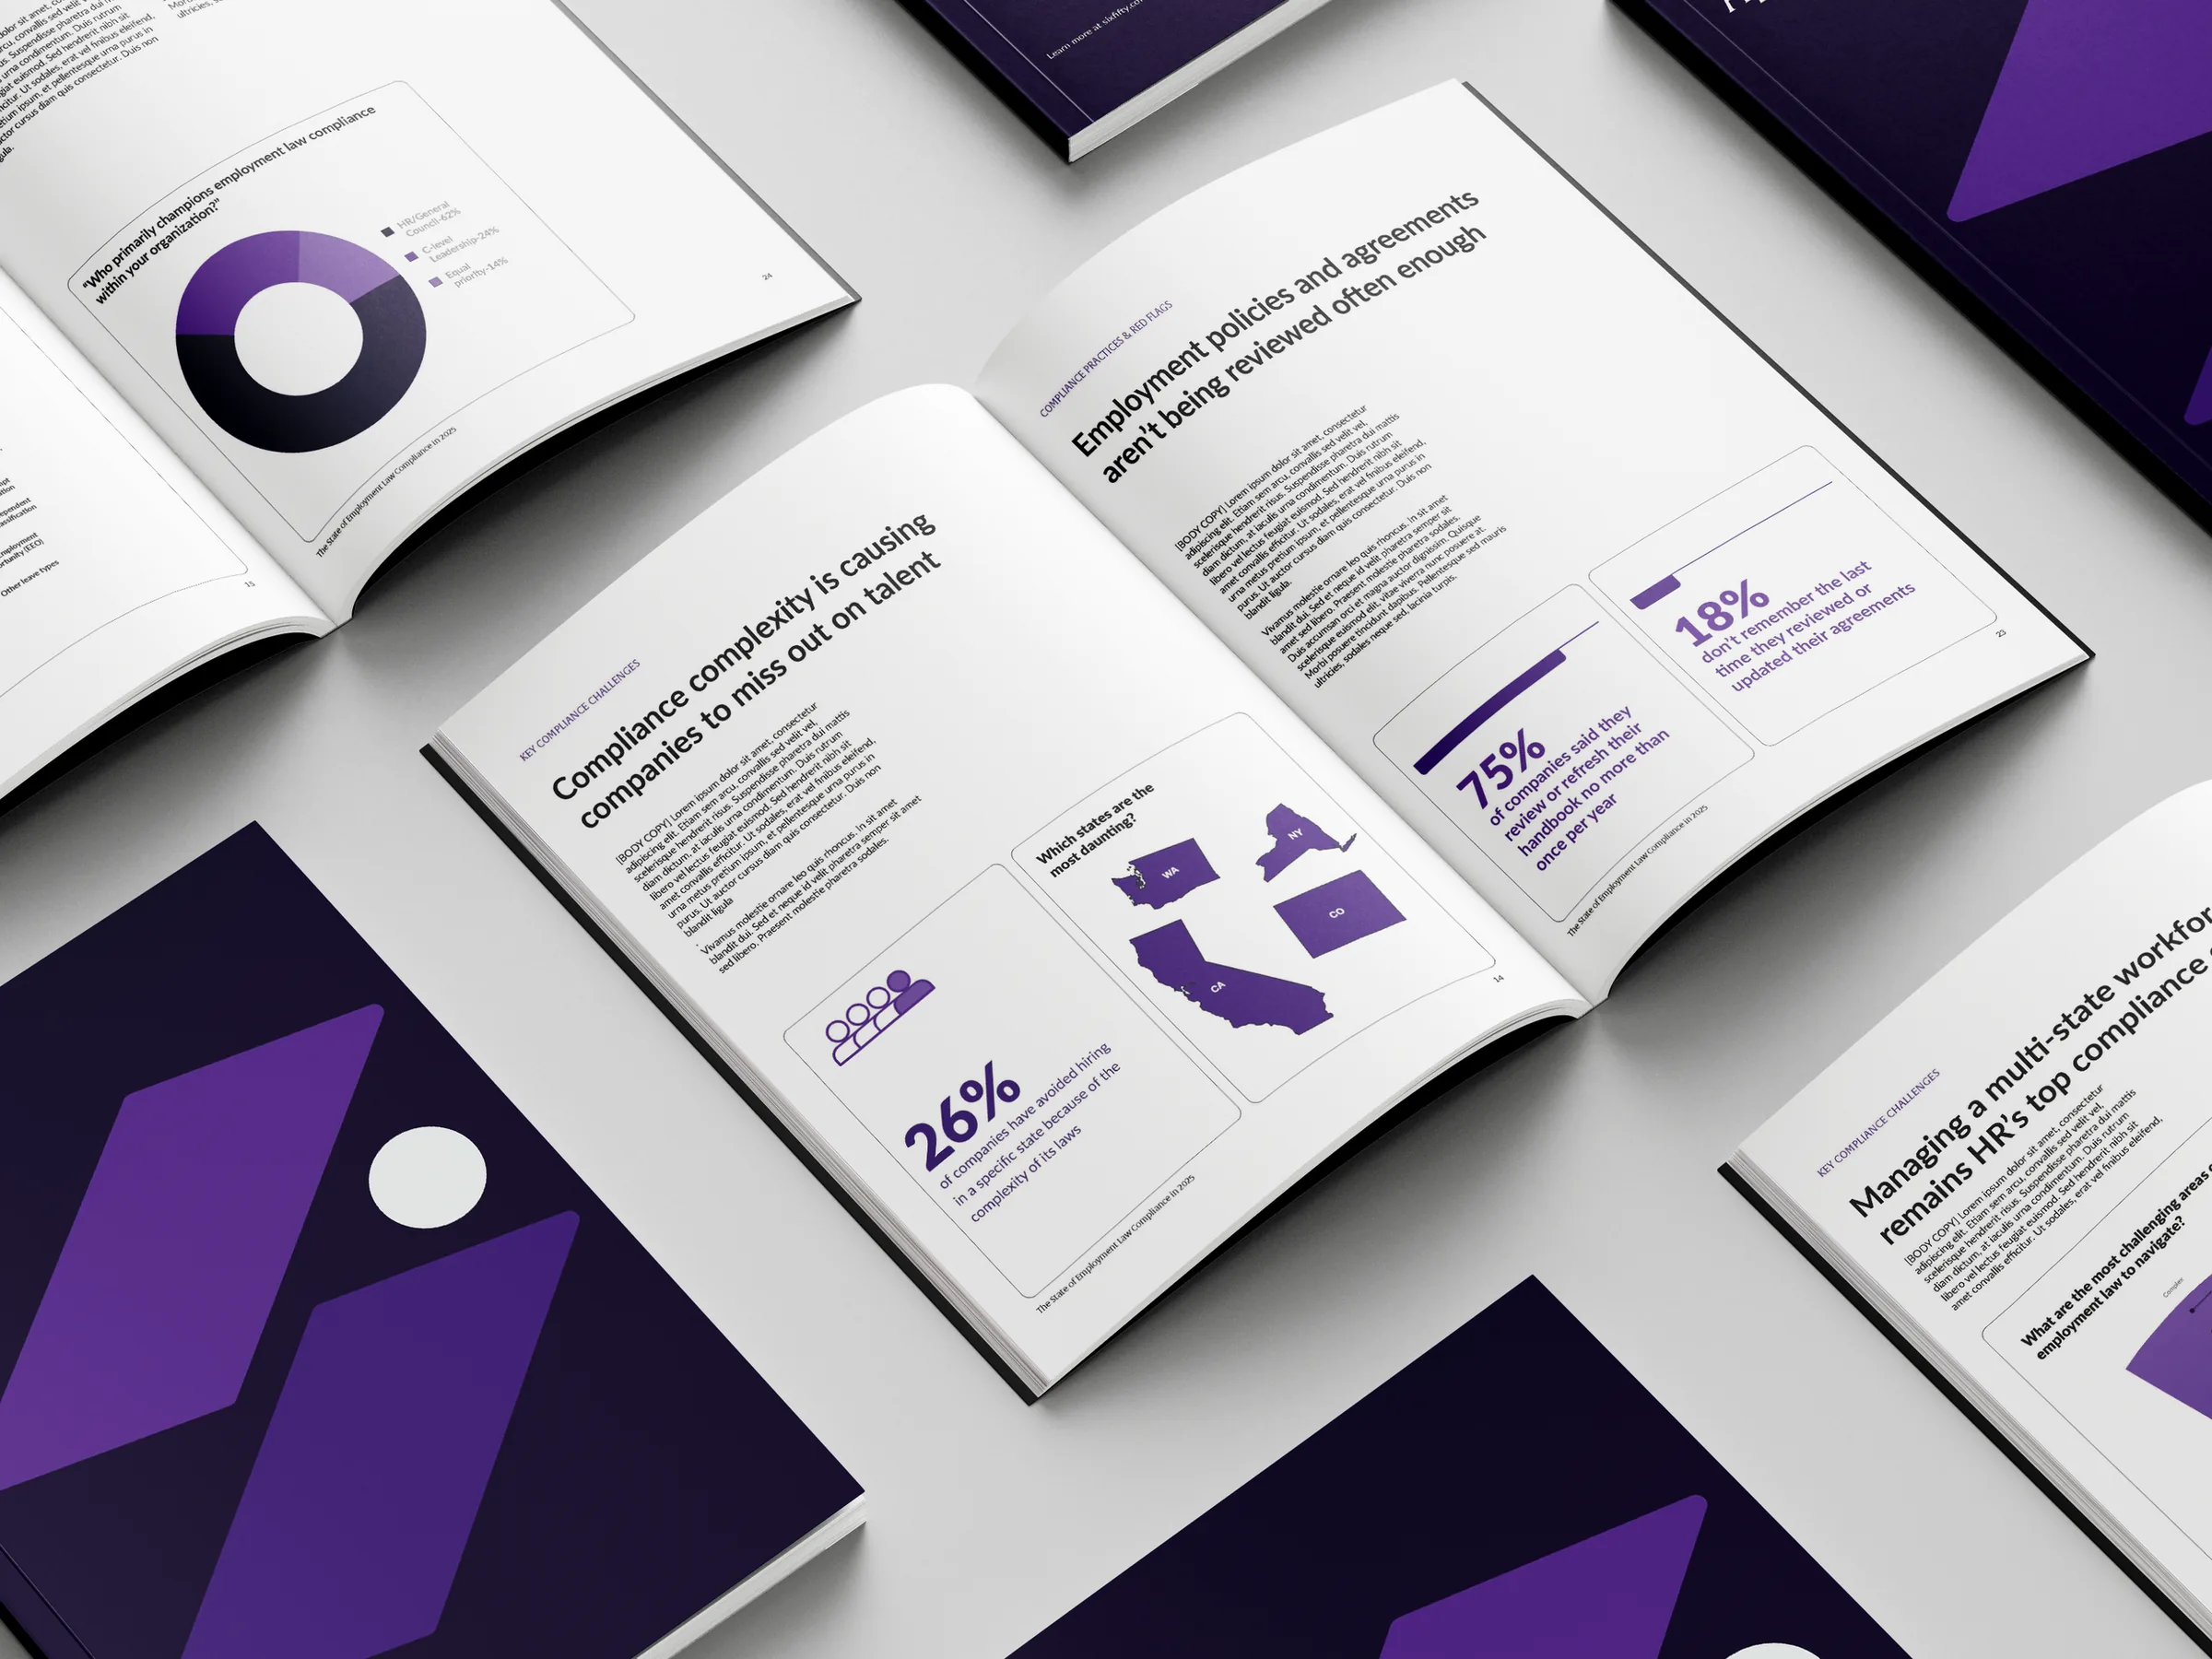
- He built it on a four-column baseline grid with custom data visualizations that make complex findings readable at a glance.
- Pacing guides readers through the research insights in SixFifty's professional tone.
Summarized by AI from this page. The long version is below.
- [ROLE]
- Freelance Graphic Designer
- [CLIENT]
- SixFifty
- [YEAR]
- 2025
[The brief]
SixFifty brought me on to design a gated report built on data from a third-party research partner. It had two jobs: position SixFifty as a thought leader in legal compliance, and be valuable enough that readers would trade their contact details for it.
[The approach]
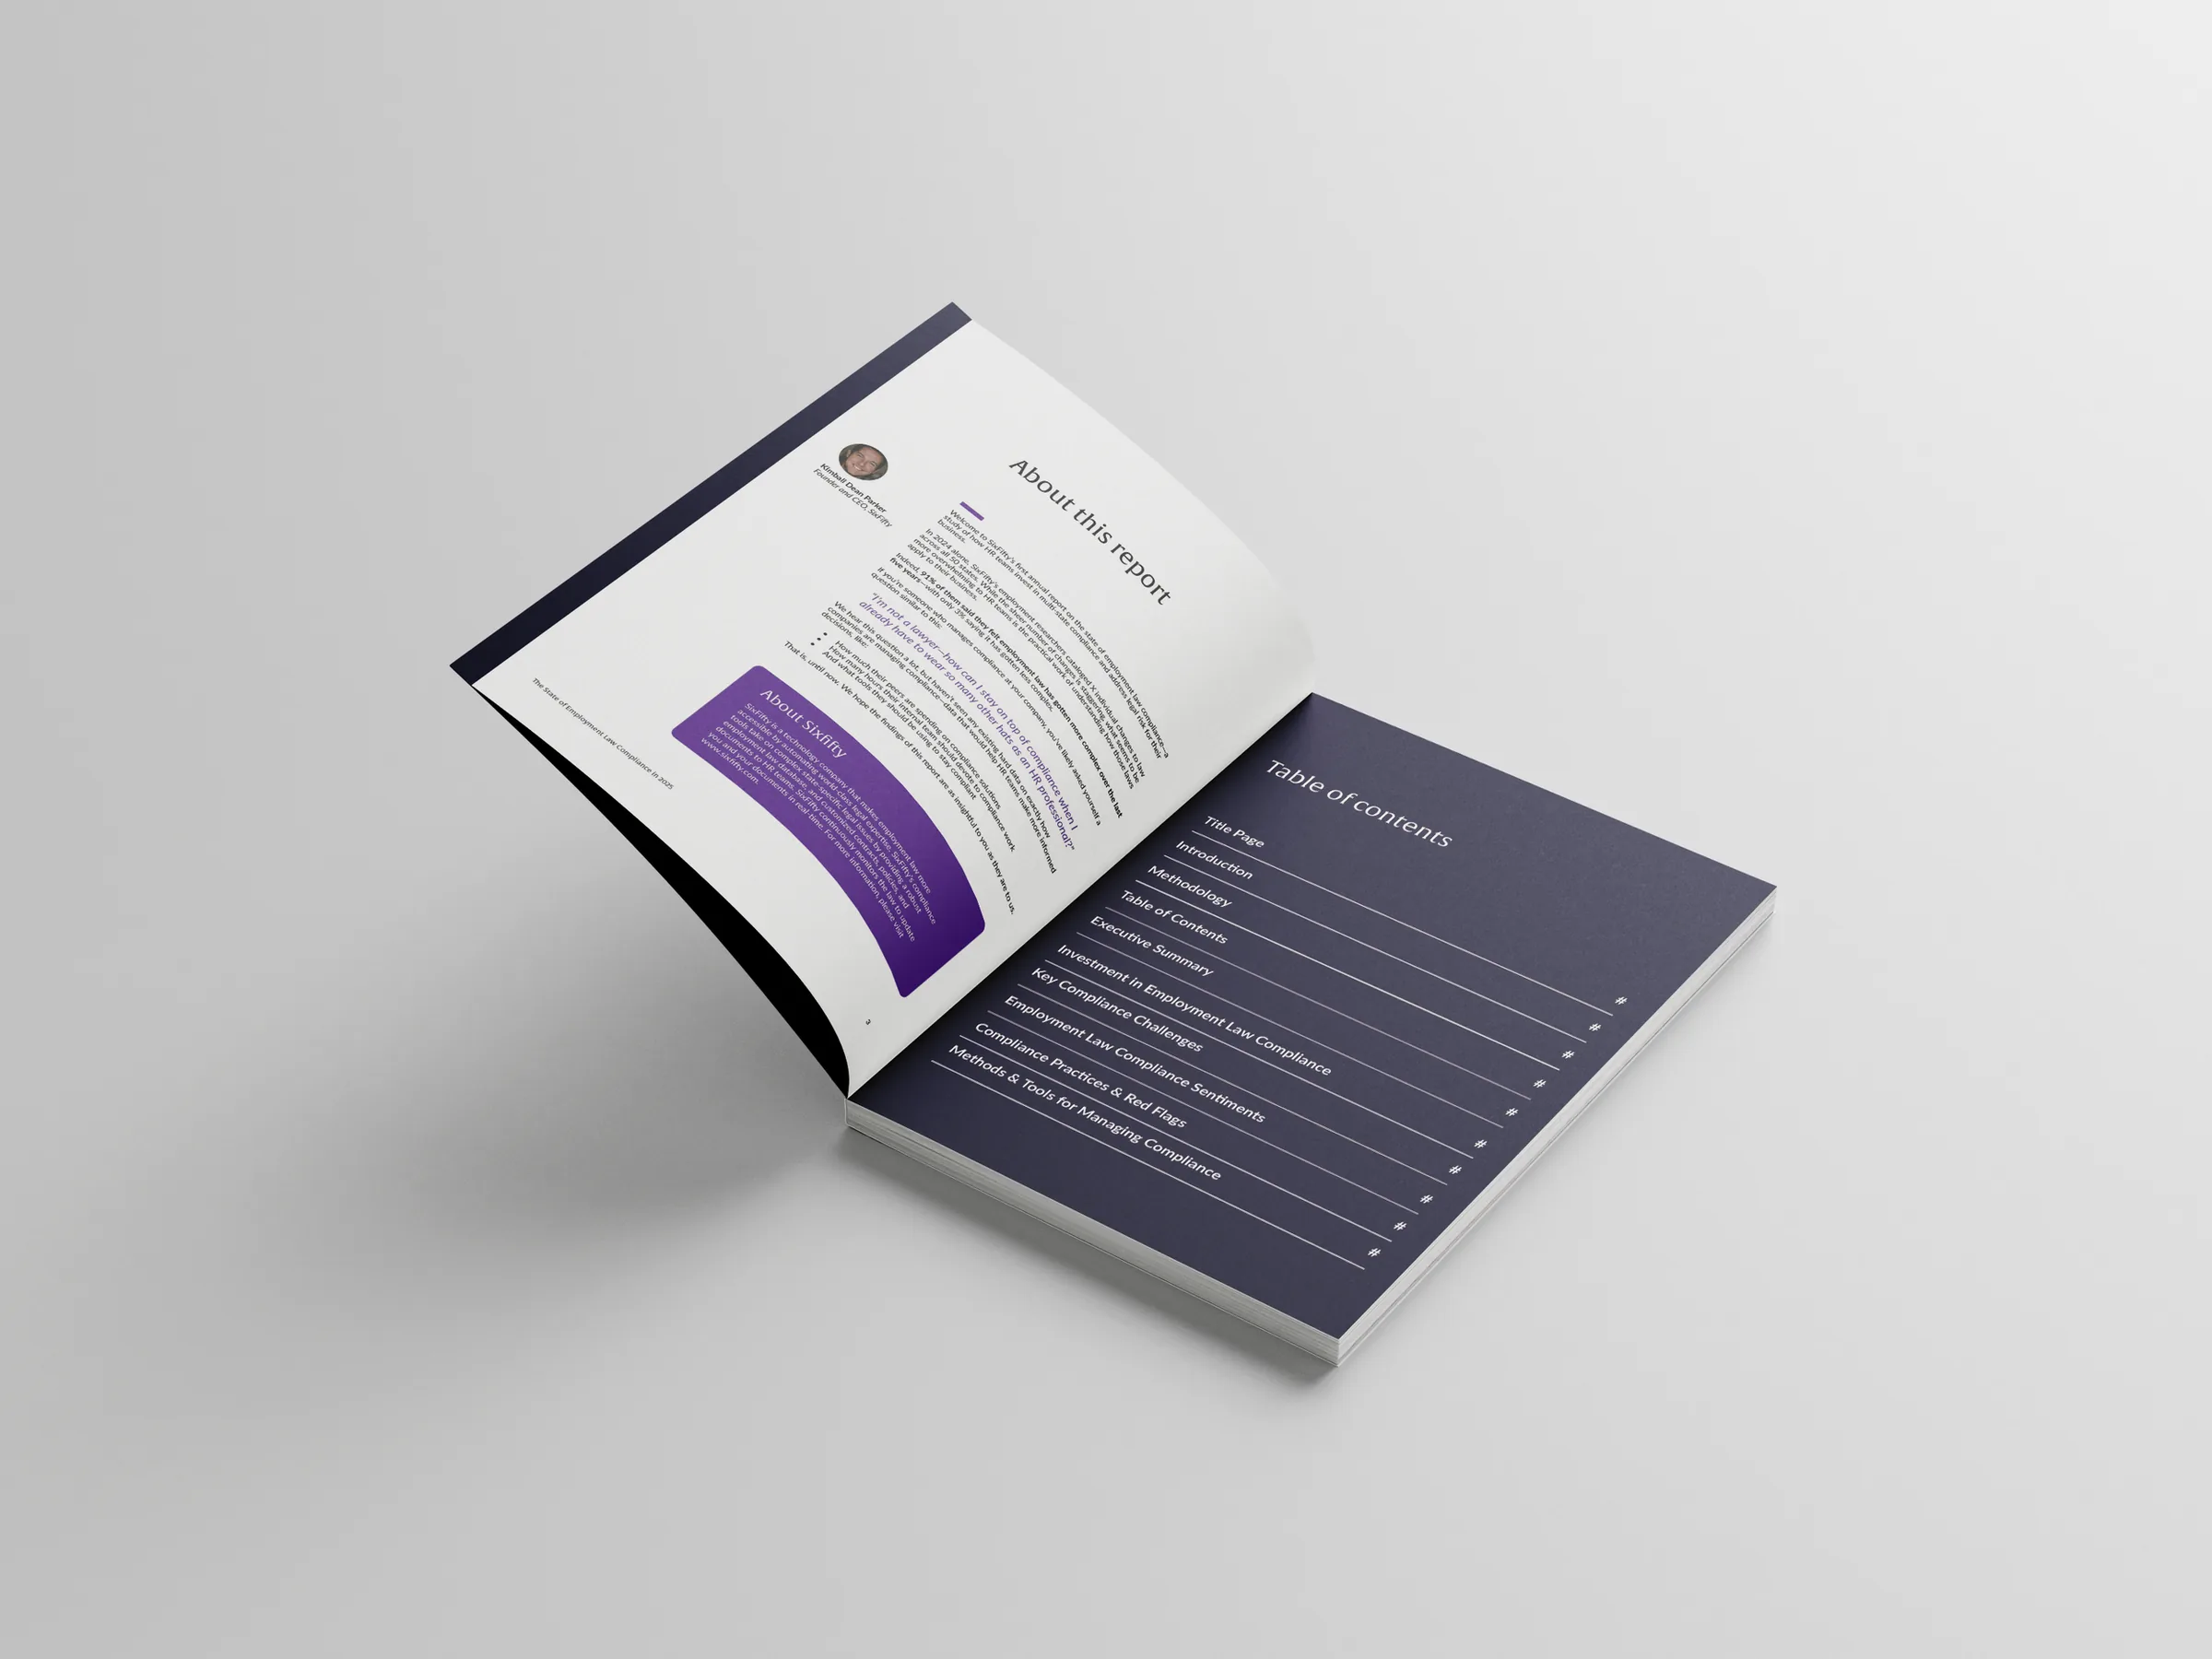
Research reports tend to read like spreadsheets. I wanted this one to read like a magazine, so I built the layout on a four-column baseline grid that could carry both narrative and data-heavy pages.
- A modular grid for clarity and typographic rhythm
- Custom data visualizations that make each finding readable at a glance
- Pacing that gives every key insight its own moment
- A polished, professional tone aligned with SixFifty's brand
TODO(ryker): any lead or download numbers? They'd go in a results band here.